https://app.senbee.com/analytics
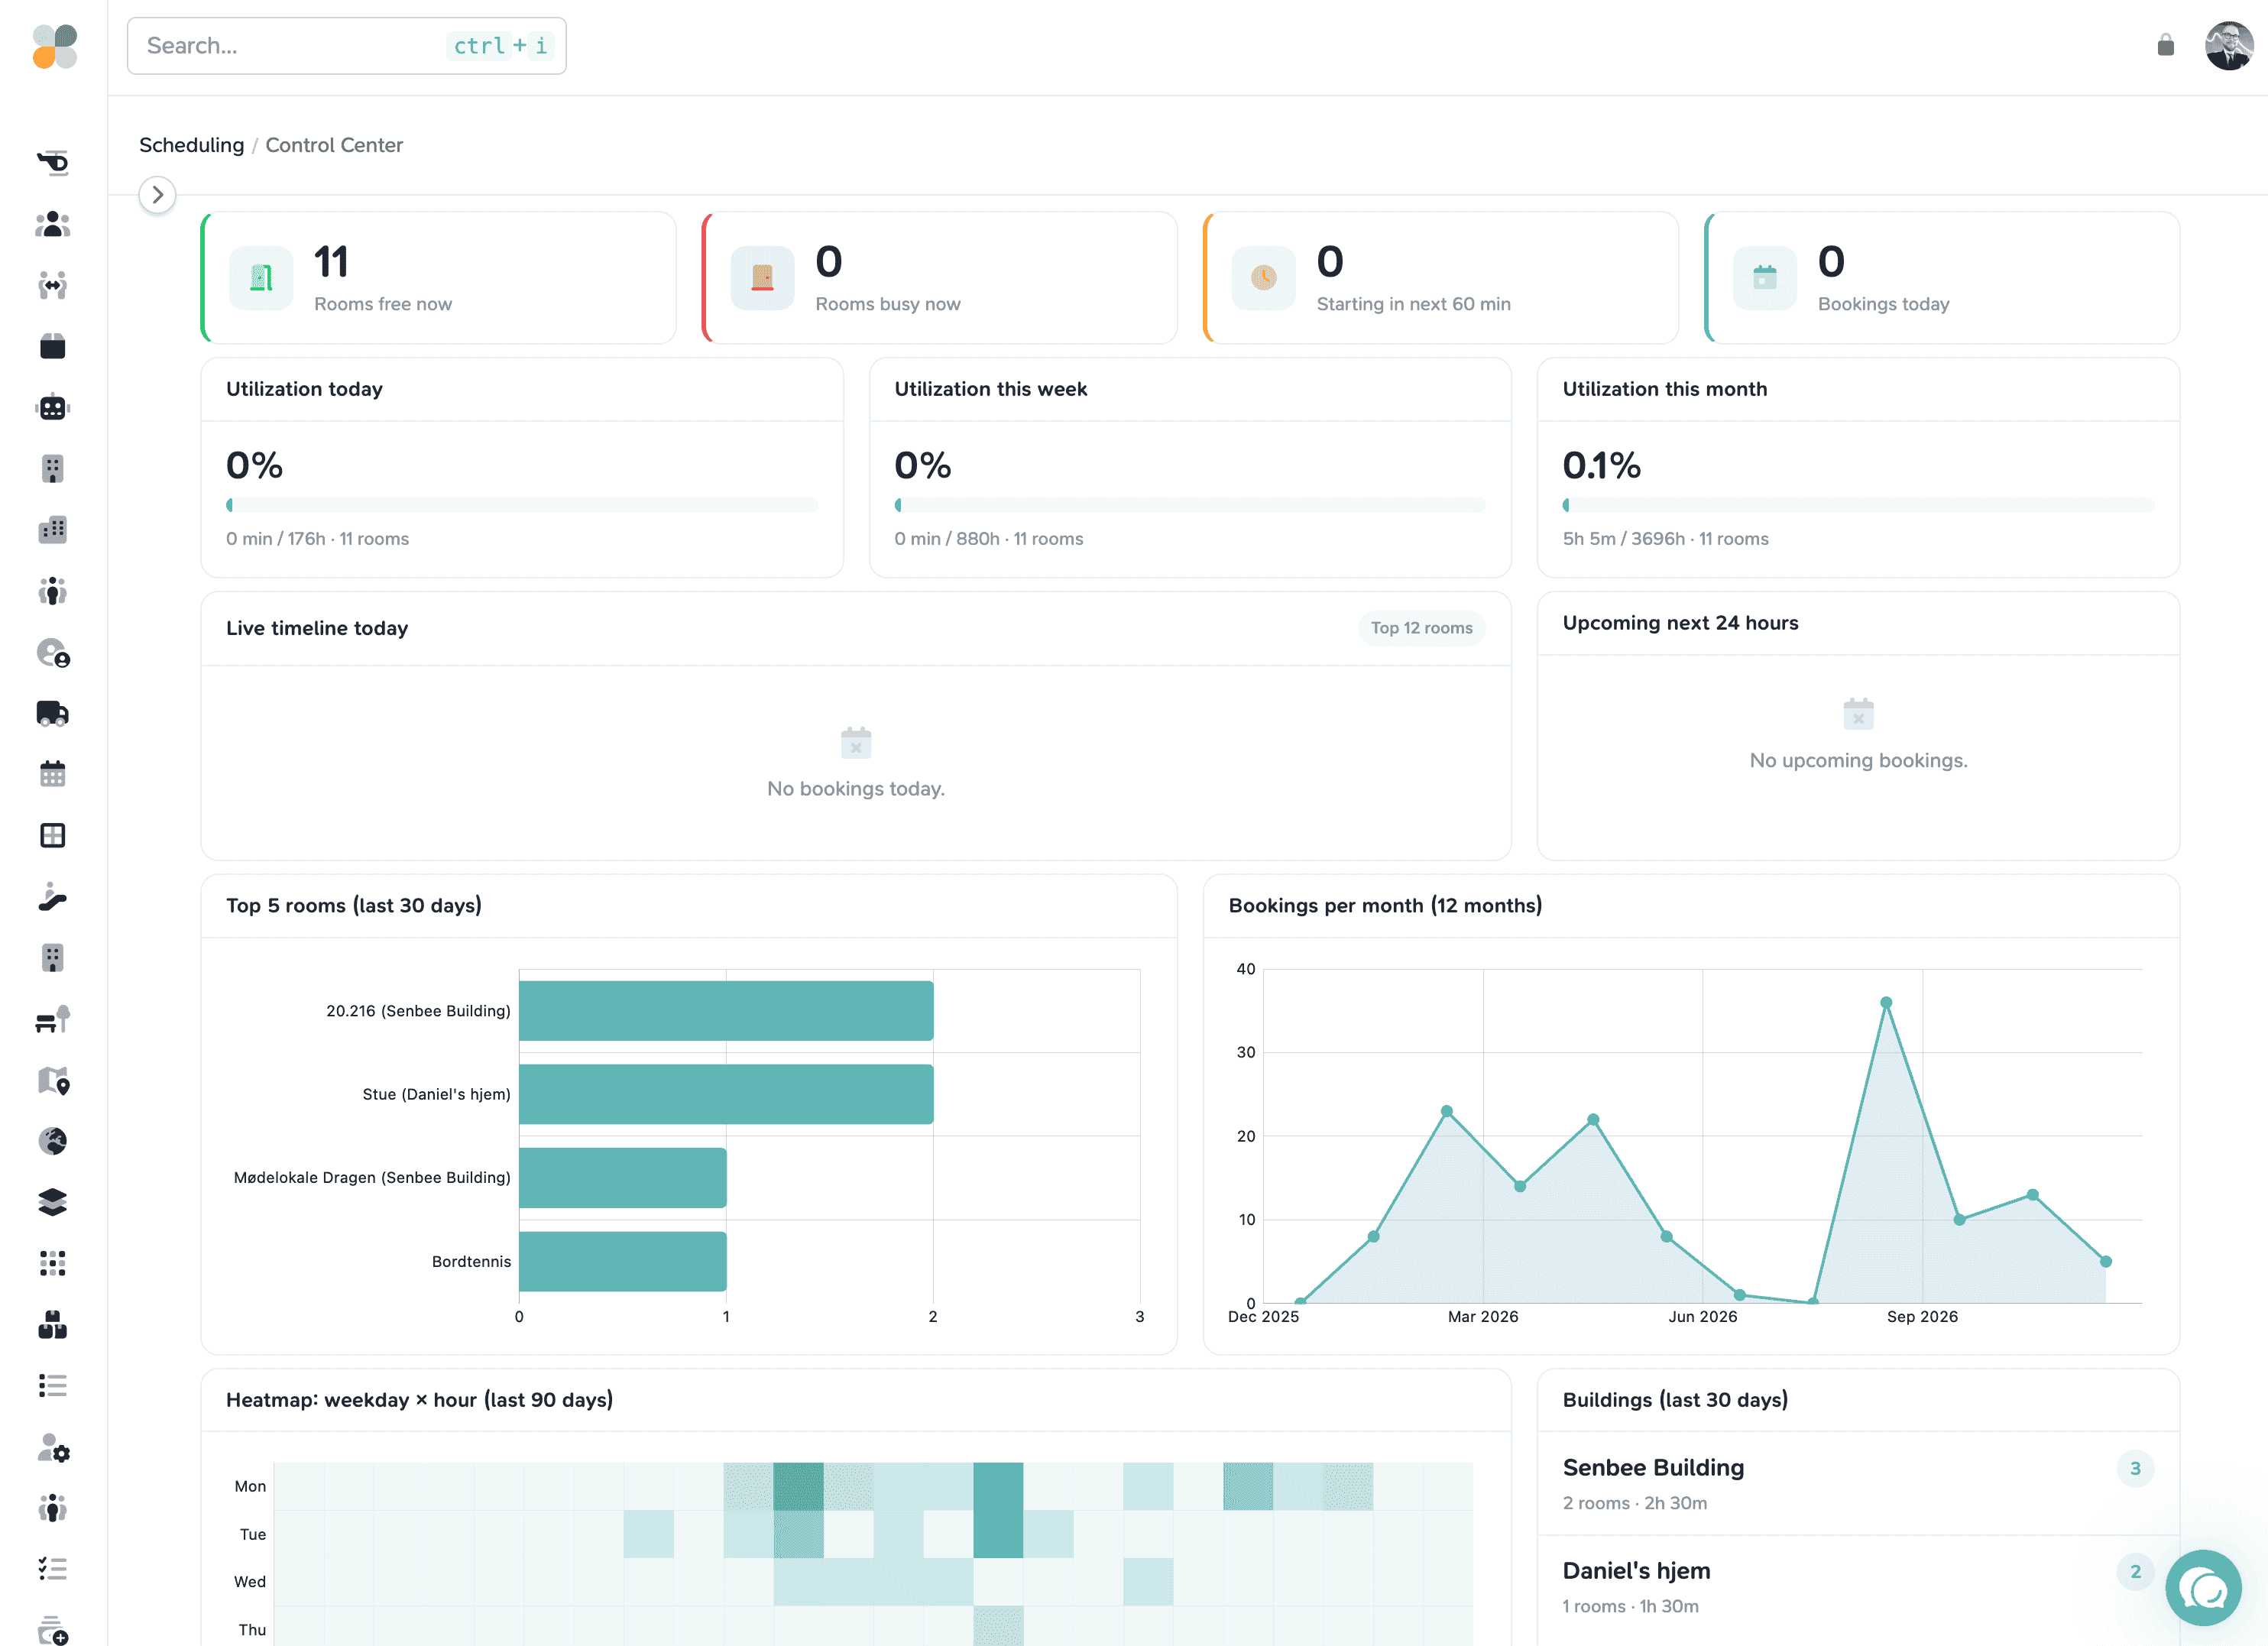
See how your buildings are actually used
Senbee runs your bookings, check-ins, catering, events and community, so Analytics sees it all. Follow how people interact with your spaces and services: which rooms they book, when they show up, what they order, and how usage shifts week by week.
- Meeting room usage over any period, peaks, dips and no-shows
- Occupancy and utilization per room, floor and building
- Check-ins, visitor flows and event attendance
- Catering orders and add-on services alongside bookings
- Compare buildings side by side across the portfolio
The right report, in the right inbox, on time
Build a report once and schedule it, weekly utilization to operations, monthly revenue to finance, quarterly portfolio numbers to the board. Export to PDF, Excel or CSV whenever you need the raw data.
Scheduled delivery
Daily, weekly or monthly reports sent automatically to the people who need them.
Exports
PDF for the board, Excel and CSV for the analysts, your data is never locked in.
API access
Pull the same numbers into your own BI stack through the Senbee API.
https://app.senbee.com/analytics
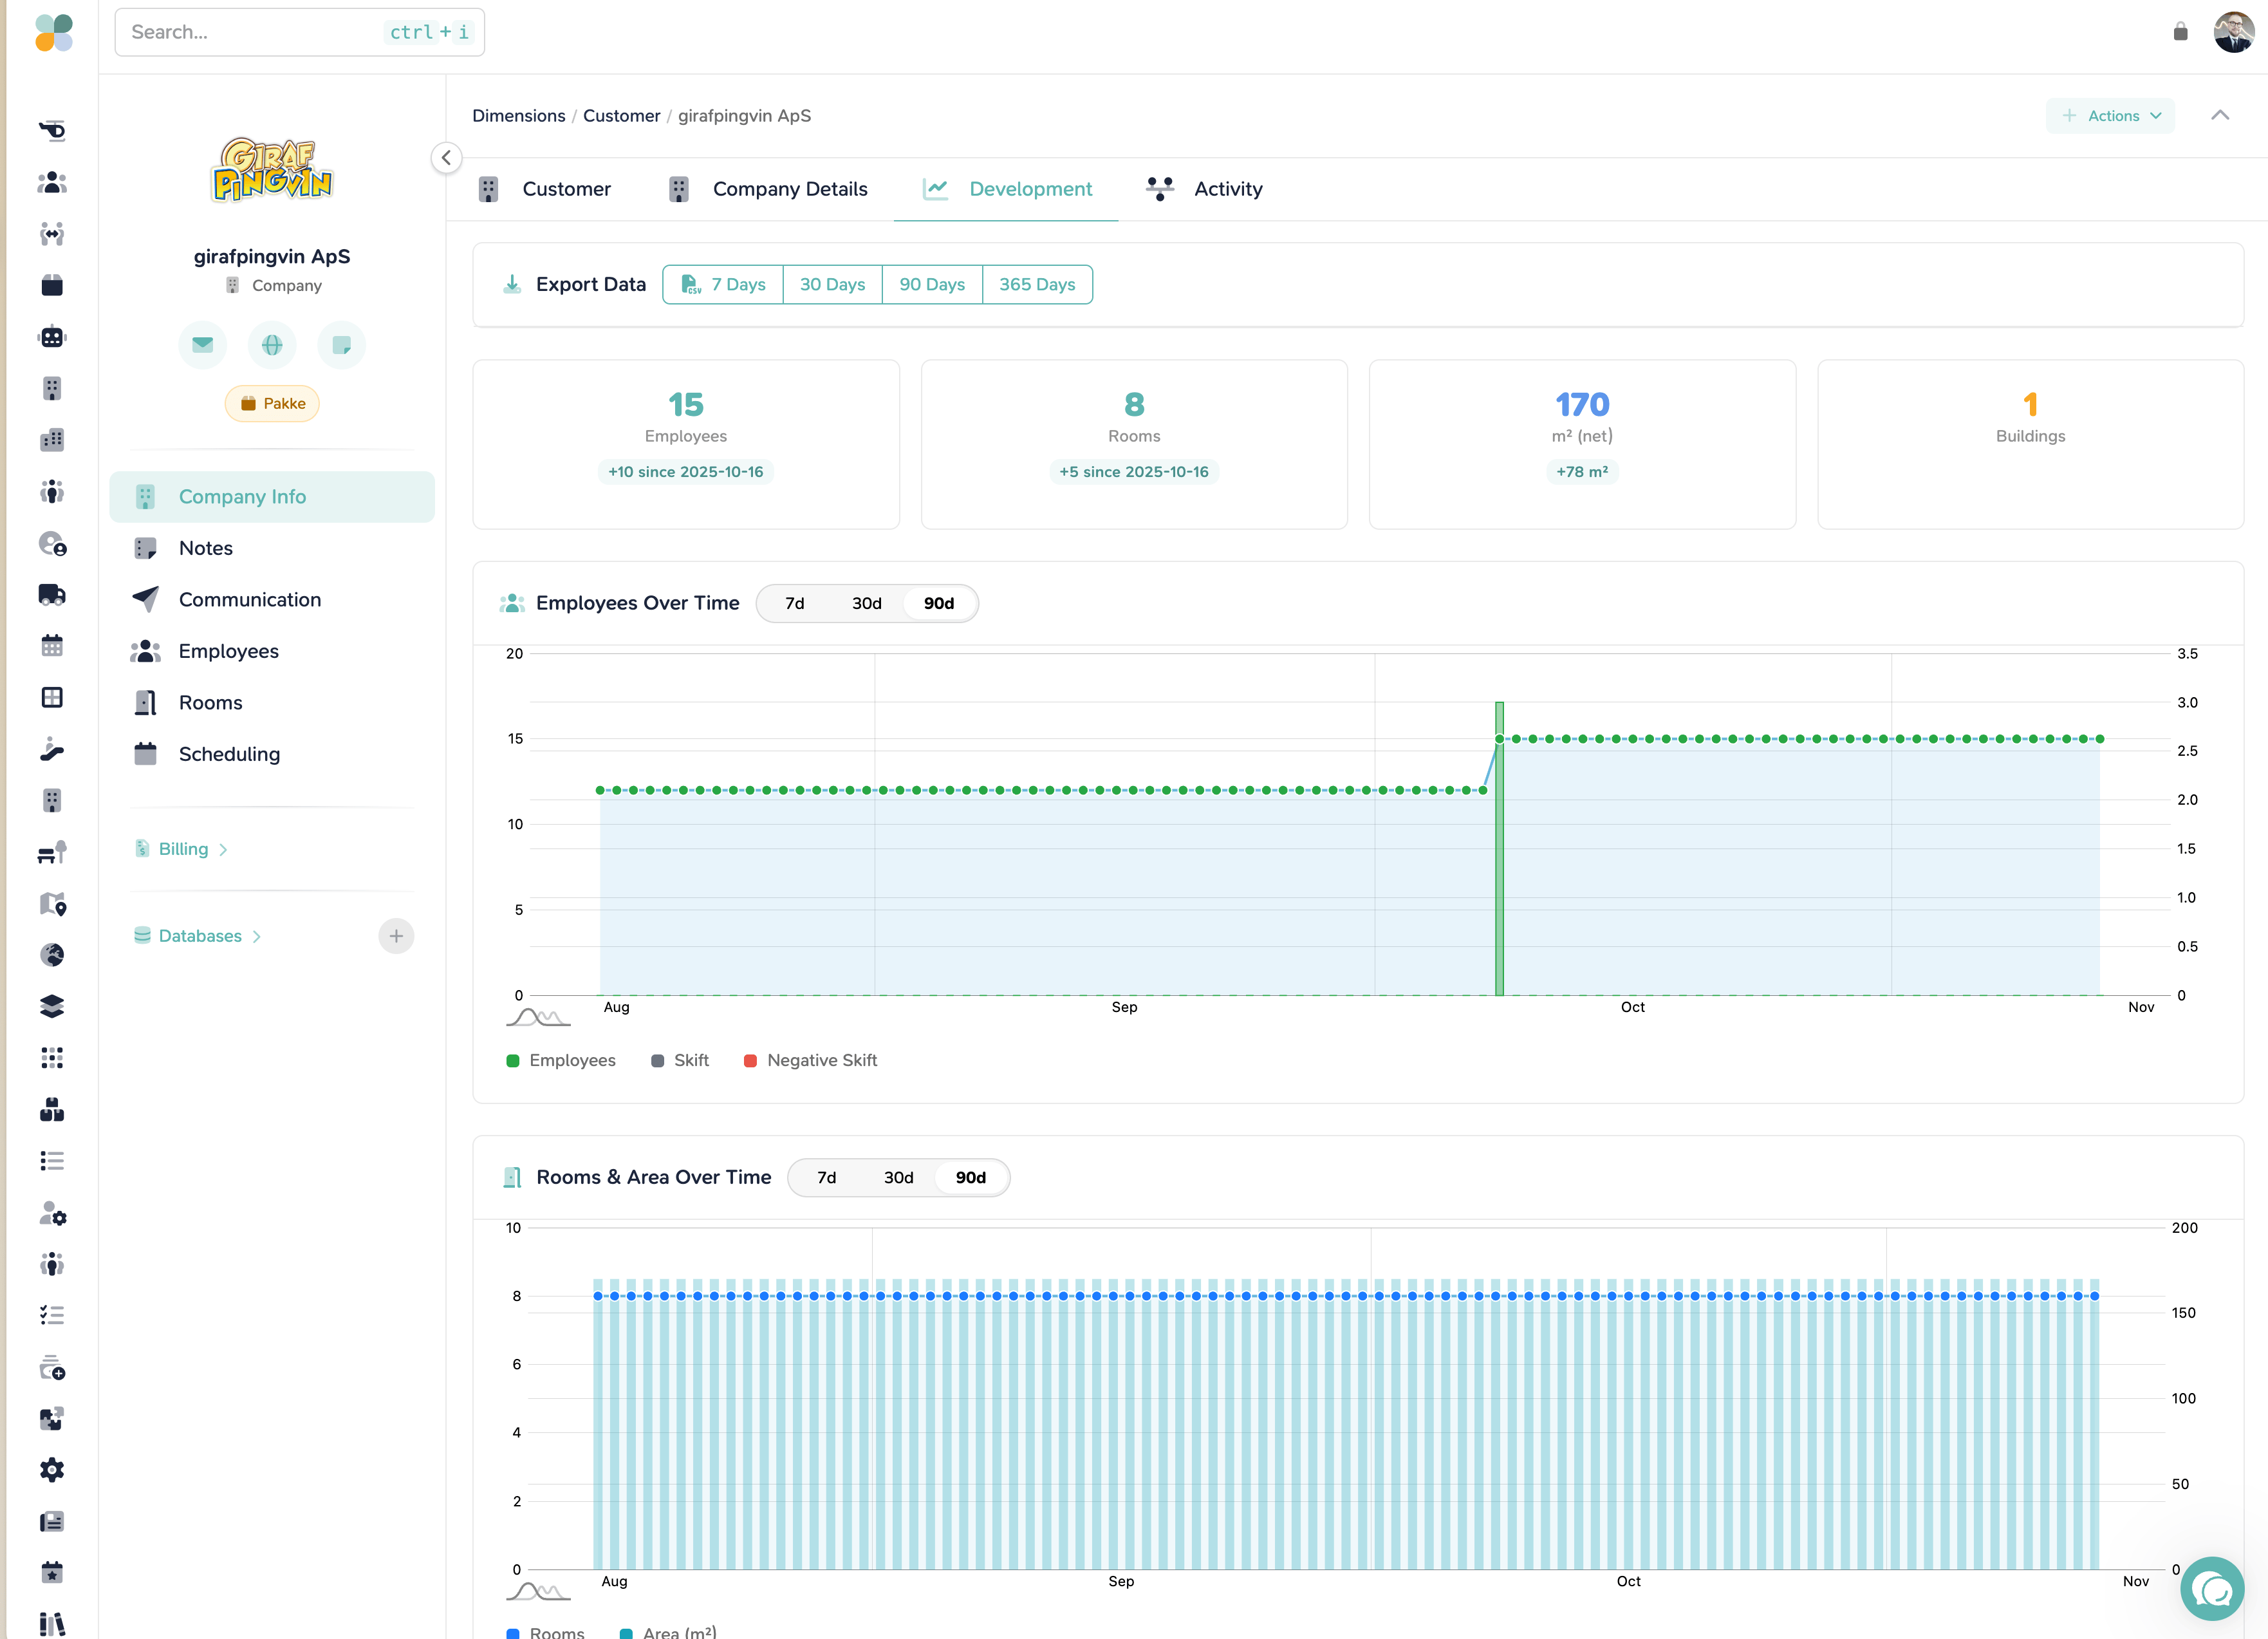
Watch customers grow, scale and move
Every company in your buildings has a story: they move in, hire, take more space, sometimes shrink, and eventually move on. Analytics tracks that whole journey over time, so you see growth and churn coming, not after the fact.
- Headcount and space footprint per company, tracked over time
- Move-ins, move-outs and internal moves across the portfolio
- Spot companies scaling up, and offer more space before they ask
- Early warning when usage drops and a tenant may be leaving
Need audit-grade compliance logs instead? That's Senbee Reporting.
What you can track
Space & occupancy
- Occupancy & utilization
- Peak hours & quiet days
- Underused rooms & floors
Bookings & meetings
- Booking patterns & no-shows
- Most-wanted rooms
- Lead times & durations
People & interactions
- Check-ins & visitor flows
- Event attendance
- Community activity
Customer growth
- Headcount over time
- Space footprint per company
- Expansions & downsizing
Movement & churn
- Move-ins & move-outs
- Internal relocations
- Churn-risk signals
Revenue & services
- Booking & catering revenue
- Add-on services
- Revenue per room and seat
Run your buildings on numbers
- Live dashboards for usage, occupancy and revenue
- Customer growth, movement and churn across the portfolio
- Scheduled reports and exports for every stakeholder
Analytics & Reporting is part of the Senbee platform, included in every plan.